I’m a long-time Home Assistant user, and have found it an incredible way to control and monitor a wide variety of devices. Home Assistant just keeps getting better at displaying information in a friendly format, and I’ve been using it to show dashboards for everything from office lighting to server stats. The latter is the focus for this blog post: Monitoring Linux servers over MQTT using Home Assistant dashboards!
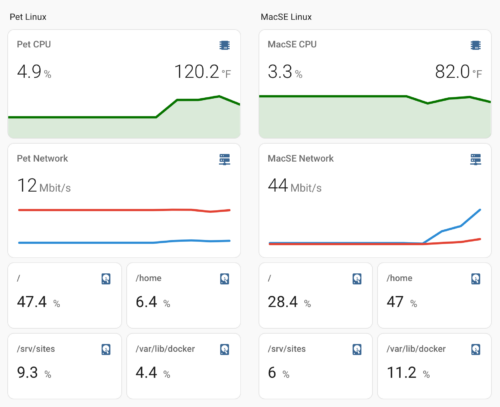
Monitoring Linux Server Stats
I’ve been a Unix admin for over 3 decades, and have spent much of that time fighting with various software packages to monitor server stats. SNMP is anything but simple, and commercial packages traditionally made a significant dent on CPU and memory resources. Then there was the issue of collecting, formatting, and filtering stats to create a useful dashboard.
Home Assistant excels at collecting information, organizing it in a database, and displaying useful graphs and dashboards. But it’s not meant to handle system statistics – Home Assistant is primarily a platform for IoT devices. Although there is an official System Monitor service, it’s intended to monitor the local server running Home Assistant, not a remote server.
Happily, there is an excellent lightweight system monitor package designed for exactly this purpose: Linux2MQTT collects system stats and exports them via MQTT. As developer Cyrill Raccaud says, “linux2mqtt is a lightweight wrapper around psutil that publishes CPU utilization, free memory, and other system-level stats to a MQTT broker. The primary use case is to collect system performance metrics for ingestion into Home Assistant (HA) for alerting, reporting, and firing off any number of automations.” I’m happy to report that it works quite well, even if it is a little fiddly.
In case you’re not familiar with MQTT, it’s a lightweight publish-subscribe message queueing protocol that’s found a niche in the IoT space. MQTT clients pass messages through an MQTT broker using “topics” that other clients can subscribe to. Home Assistant has an open source MQTT broker Add-On called Mosquitto as well as an MQTT client, and many IoT devices like my Tasmota lights and Shelly switches already use this protocol for control and metrics. A client like linux2mqtt can easily publish system stats to a broker like Mosquitto for use in Home Assistant.
Installing and Running linux2mqtt in Ubuntu
The linux2mqtt package is written in Python and is available on Pypi, making it easy to install and maintain. But I do have a few tips and tricks to share to get it up and running monitoring Ubuntu servers.
A best practice in Debian and Ubuntu (and frankly all Unix systems) is to install Python packages in a virtual environment to maintain proper version of the Python interpreter and libraries. This functions something like a container (though less isolated or portable) and overcomes many of the headaches of maintaining a usable Python environment.
Note that linux2mqtt runs as a user, not as root. This should be reassuring but also poses some issues we will overcome!
Creating a venv for linux2mqtt is our first step:
sudo apt update
sudo apt install python3-venv
python3 -m venv ~/linux2mqtt
Now that we have a proper venv set up in our user home directory we can install linux2mqtt inside:
~/linux2mqtt/bin/pip install linux2mqttWe now have a version of linux2mqtt installed and ready to test out!
Preparing Home Assistant
Configuring Mosquitto and the MQTT client in Home Assistant is far beyond the subject of this article. Suffice to say, the built-in Home Assistant Mosquitto broker and client are sufficient for everything we are doing here, though you could also use any other broker if you choose.
The important thing is that you have the IP address, username, and password of your MQTT broker. For purposes of this illustration I will use the following:
- MQTT Broker IP: 192.168.1.31
- MQTT Broker User: mosquitto
- MQTT Broker Password: password
Make sure the MQTT client is up and running in “Devices & Services” and is configured to query the Mosquitto broker. By default, Home Assistant uses “homeassistant” as the MQTT auto-discovery prefix, and this is also the default for linux2mqtt. If you change this prefix you will need to specify the new one using the –homeassistant-prefix command line parameter.
Happily, Home Assistant will properly receive and organize incoming data from linux2mqtt without any other setup. As soon as you start publishing system data to the broker a new device and associated entities will appear in Home Assistant!
Selecting System Metrics
It’s a good idea to pick out the specific system metrics to send to Home Assistant before running linux2mqtt for the first time. For the purposes of this article, we will send CPU percentage, CPU temperature, network utilization, and filesystem usage. Some of these requires a little preparation work, so let’s dive in!
We’ll build a metric set to send to the MQTT broker interactively, but here’s a good baseline:
~/linux2mqtt/bin/linux2mqtt \
--name $HOSTNAME \
--cpu=15 \
--vm \
--temp \
--fan \
--du='/' \
--du='/home' \
--net=enp0s1,15 \
--host=192.168.1.31 \
--username=mosquitto \
--password=password \
-vvvvv
One of the most important command line parameters is “–name $HOSTNAME“. This identifies all of the state metrics in MQTT and Home Assistant. You can use $HOSTNAME (as I did here) or specify a name manually. I like Initial Capital Letters so I generally specify the hostname manually.
The easiest sensor to add is CPU. Just add “–cpu=60” to the linux2mqtt command line and it will send overall CPU usage plus a number of detailed state attributes (see below) each minute. I actually like to use “–cpu=15” to get more frequent updates (every 15 seconds) but you’re free to choose any value you like.
Another useful sensor is virtual memory. Add “–vm” to the command line to send virtual memory usage plus detailed state attributes. I wish there was more instrumentation for physical memory, but I can’t find it.
Each server platform will have its own set of temperature metrics, and mine are all over the map. Some provide a ton of detailed thermal info with “–temp” for various zones while others just show the CPU. Not all systems will show fan status, but it doesn’t break anything to add “–fan” just in case. If your server doesn’t have fan sensors you could leave this off the final parameter list.
Next we want to collect disk usage stats. Most people will add “–du=’/’” to collect root directory stats. Being a veteran sysadmin and storage nerd I like to use separate filesystems for things that might fill up, including /home, /var/lib/docker, and various application directories in /srv. Just run “df -h” on the command line and decide which volumes you want to include. Then add multiple parameters like “–du=’/home’” to the list.
You can also monitor one or more network interfaces. You will need to specify the specific interface name on the command line, and the easiest way to get this is by typing “ip address show | more” on the command line. If you’re using Docker or similar tools you might have quite a few! I’ve simplified it above to just “–net=enp0s1,15“, which will send stats for the interface called enp0s1 every 15 seconds. You can add multiple parameters with different network names to monitor multiple interfaces.
Next we have to specify the MQTT Broker with “–host=192.168.1.31” and authenticate with “–username=mosquitto” and “–password=password“. Obviously you’ll use your own broker IP address, username, and password.
Finally we can add “-vvvvv” to show verbose debugging info on our first run. We will leave this out when we put this into production.
Now that you have figured out which parameters to use for your particular host, you can simply run linux2mqtt on the command line:
~/linux2mqtt/bin/linux2mqtt --name $HOSTNAME --cpu=15 --vm --temp --fan --du='/' --du='/home' --net=enp0s1,15 --host=192.168.1.31 --username=mosquitto --password=password -vvvvvThis will start collection and begin sending data to the MQTT broker. Within a few seconds you will see this show up in Home Assistant under the MQTT client! Once you’re satisfied you can stop this initial run with ctrl-c and proceed to put linux2mqtt into production!
Creating a Systemd Service for linux2mqtt
I am not a fan of systemd but that’s what Debian and Ubuntu use to run system services. And it works. So we’re going to use it.
Although many of us have mucked about with system services, I was less familiar with using systemd to run user-space services. But that’s the right way to run linux2mqtt, since it does not need root privileges.
We’ll create a systemd service file in our home directory for linux2mqtt:
mkdir -p ~/.config/systemd/user
vi ~/.config/systemd/user/linux2mqtt.service
This service file will be pretty simple. The most important bit is the command used to run linux2mqtt, which we developed in the previous section. Copy whatever worked at the end there as the “ExecStart” command in the following template. You should specify the complete directory path rather than “/home/username” and the proper hostname in this file. I’ve bolded these below. And don’t include the “-vvvvv”.
[Unit]
Description=Log system information via MQTT
DefaultDependencies=no

[Service]
ExecStart=/home/username/linux2mqtt/bin/linux2mqtt --name Hostname --cpu=15 --vm --temp --fan --du='/' --du='/home' --net=enp0s1,15 --host=192.168.1.31 --username=mosquitto --password=password
Type=exec
Restart=always

[Install]
WantedBy=default.target
Assuming you’re ready to roll, just enable these using systemd and you’re done on the host side! Note that you need to enable “linger” so systemd can run things when you’re not actively logged in.
sudo loginctl enable-linger $USER
systemctl --user daemon-reload
systemctl --user enable linux2mqtt.service
systemctl --user start linux2mqtt.service
Home Assistant State Attributes
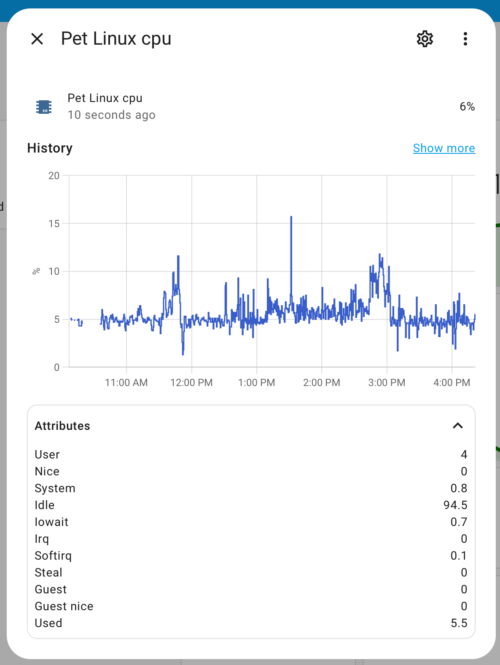
The first thing to understand about linux2mqtt is that it sends a basic state plus a number of state attributes for each sensor. For example, the CPU sensor displays percentage used by default but also sends User, Nice, System, Idle, and so on as “Attributes”. These can be seen in the Home Assistant UI by clicking the Attributes dropdown box below the sensor History graph. You can show these attributes in some (but far too few) dashboard cards, or you can create a helper template to use them anywhere.
I don’t love this. But it’s what we have to work with.
The easiest thing to do is simply use the basic/default sensor attributes when building Home Assistant cards. This works pretty well for CPU and temperature sensors, and I’m using those as-is. Total Rate isn’t too bad for network usage, but I would prefer to show transfer and receive rate. And I’m really not happy with a display of bytes used as my disk statistic.
Happily, the default Entity Card can show Attributes right from the GUI. I just selected Percent under Attributes, added “%” as the Unit, and added a sensible Name. Once you add this, Home Assistant will even show you a proper historic graph for this Attribute when you click on the value. Nice!
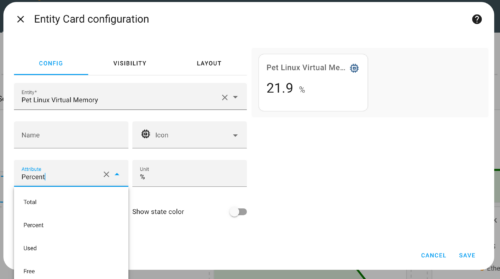
Looking in the Code Editor, we can see how the Entity Card specifies this Attribute in yaml:
type: entity
entity: sensor.pet_linux_disk_usage_volume
attribute: percent
unit: "%"
name: /
This gives us clues as to how to present this information in other Cards. Some can handle Attributes if you enter them in the Code Editor, while others simply can’t display them. Sadly the Glance Card does not support Attributes, but I was able to create some slick Cards!
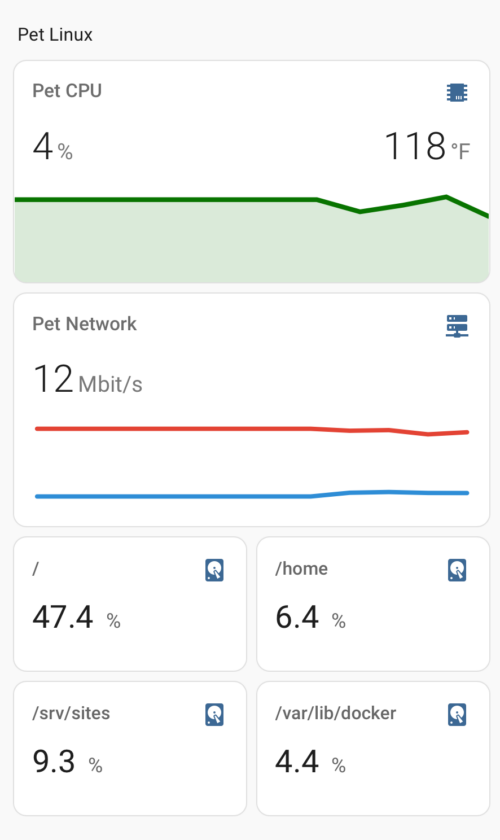
The linux2mqtt page suggests using kalkih’s mini-graph-card to display graphs of sensor data, and I found it to be quite attractive once I customized it. This Card is available in HACS – just search for mini-graph-card!
Although mini-graph-card doesn’t support visual editing, it’s fairly easy to add Attributes to its graphs. For example, here’s my yaml for a slick network graph:
type: custom:mini-graph-card
entities:
  - entity: sensor.pet_linux_network_throughput_nic_enp2s0
    show_graph: false
  - entity: sensor.pet_linux_network_throughput_nic_enp2s0
    attribute: tx_rate
    name: Transmit
  - entity: sensor.pet_linux_network_throughput_nic_enp2s0
    attribute: rx_rate
    name: Receive
hours_to_show: 24
decimals: 0
name: Pet Network
lower_bound: 0
smoothing: false
show:
  legend: false
  fill: false
  points: false
The resulting card shows aggregate throughput as well as transmit and receive graphs for the host Pet. You’ll note that the basic aggregate throughput is displayed but not graphed while the transmit and receive stats are graphed on the same scale. I hid the legend, points, and fill since they were simply visual clutter.
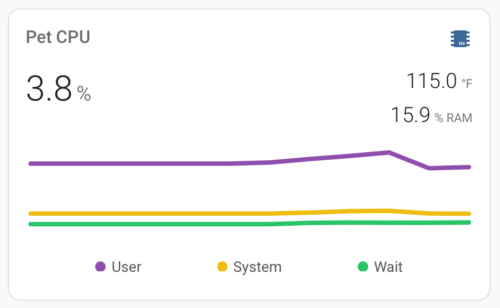
Here’s a nice mini-graph-card setup for CPU and memory. Substitute your own sensor IDs as needed:
type: custom:mini-graph-card
entities:
  - entity: sensor.pet_linux_cpu
    show_graph: false
  - entity: sensor.pet_linux_thermal_zone_k10temp_tctl
    show_state: true
    show_graph: false
  - entity: sensor.pet_linux_virtual_memory
    attribute: percent
    unit: "% RAM"
    show_state: true
    show_graph: false
  - entity: sensor.pet_linux_cpu
    attribute: user
    name: User
  - entity: sensor.pet_linux_cpu
    attribute: system
    name: System
  - entity: sensor.pet_linux_cpu
    attribute: iowait
    name: Wait
hours_to_show: 24
decimals: 1
name: Pet CPU
smoothing: false
show:
  fill: false
  points: false
Stephen’s Stance
This little project of adding remote system stats to a Dashboard illustrates what I love and hate about Home Assistant. It’s an excellent platform for collecting and displaying metrics and has an incredible ecosystem of add-ons and supported protocols. But actually getting what you want can be frustrating and fidgety, as witnessed by the spotty support for Attributes in various cards. It’s frustrating that Attributes are not supported in the Glance card or the new Badges, for instance. But I was ultimately able to make it all work, and the result was worth the effort.
Leave a Reply